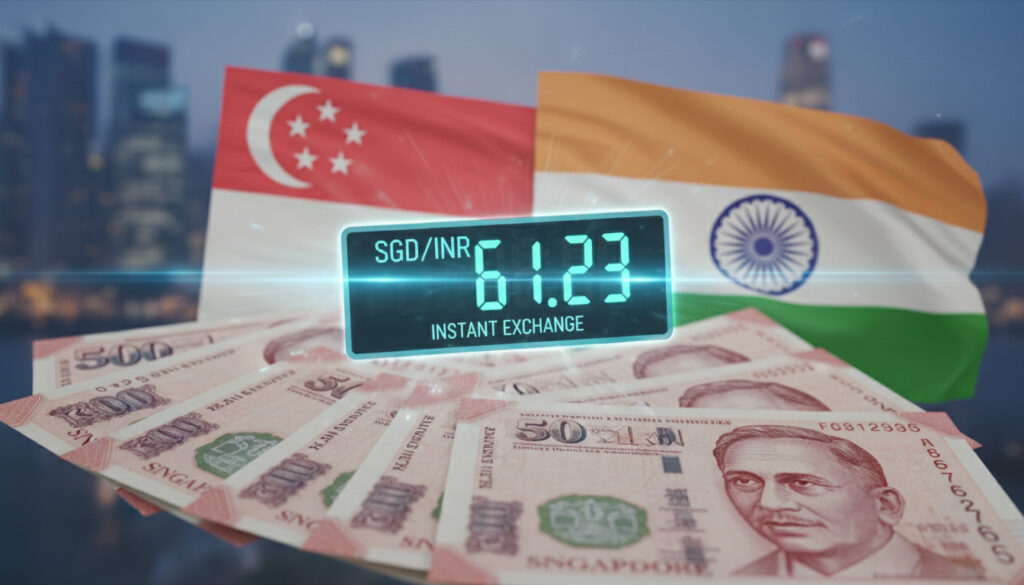
SG to India Currency – Latest Rate and Converter
The Singapore Dollar to Indian Rupee exchange rate currently trades near 72.30 INR per 1 SGD, with live quotes across major providers ranging from 71.62 to 73.41 depending on platform fees and spread structures.
This currency pair serves as a critical financial corridor for remittances, trade settlements, and investment flows between Southeast Asia and South Asia. Daily fluctuations remain modest, with recent volatility measuring under 0.5% on monthly averages.
Understanding real-time valuations requires monitoring mid-market benchmarks alongside actual transfer rates, which often diverge due to banking markups and service charges.
What is the Current SGD to INR Exchange Rate?
- Mid-market rates cluster tightly around 72.30 INR per SGD across aggregated sources.
- Retail providers display spreads exceeding 2% between lowest and highest quoted rates.
- Weekly volatility remains exceptionally low at 0.24%, indicating stable trading conditions.
- Monthly averages settle near 72.56–72.65 INR despite intraday fluctuations.
- Inverse calculations place 1 INR at approximately 0.014 SGD.
- Common conversion blocks show 1,000 SGD equating to roughly 72,300 INR at current mid-market levels.
- Timestamp disparities exist; Xe data reflects 23:07 UTC April 6, 2026, while others show current March 2026 snapshots.
| Metric | Value | Source |
|---|---|---|
| Base Currency | Singapore Dollar (SGD) | ISO 4217 |
| Quote Currency | Indian Rupee (INR) | ISO 4217 |
| Mid-Market Rate | ~72.30 INR | Aggregated |
| Wise Rate | 71.62 INR | Wise |
| Aspora Rate | 73.41 INR | Aspora |
| Xe Rate | 72.32 INR | Xe |
| Ibrlive Rate | 72.10 INR | Ibrlive |
| Investing.com Rate | 72.39 INR | Investing.com |
| 30-Day Average | 72.65 INR | Market Data |
| Inverse Rate | ~0.014 SGD | Calculated |
Where to Find a Reliable SGD to INR Converter?
Digital-First Platforms and Fintech Providers
Specialized currency platforms including Wise, Xe, and Revolut offer real-time conversion tools that track mid-market rates with transparent fee disclosures. These services update pricing every 60 seconds during active trading hours.
Traditional Banking Channels
Major retail banks typically embed 2–5% markups above mid-market rates, masking the true cost within exchange spreads rather than explicit fees. OFX and Western Union provide institutional alternatives, though rate estimates vary significantly by transfer method and corridor.
Comparing the offered rate against the mid-market benchmark before confirming transfers reveals hidden costs. A difference of even 0.50 INR per SGD accumulates to 500 INR in additional charges on 1,000 SGD conversions.
Historical SGD to INR Exchange Rates and Chart
Recent Volatility Metrics
Seven-day trading data reveals a tight range between 72.11 and 73.48 INR, averaging 72.56 with minimal deviation. Thirty-day charts expand this band to 71.58–73.79 INR, averaging 72.65 and demonstrating the pair’s characteristic stability.
Twelve-Month Trajectory
Live charting available through Xe and Investing.com indicates gradual INR appreciation against SGD throughout the previous year. This trend reflects underlying trade balance shifts and regional economic growth differentials rather than abrupt speculative movements.
How Does the SGD to INR Rate Fluctuate?
Micro-Volatility Patterns
Short-term fluctuations remain constrained, with weekly volatility at 0.24% and monthly figures at 0.41%. These metrics support predictable remittance planning, as rate swings rarely exceed 1.5 INR within standard settlement windows.
Macroeconomic Influences
While specific central bank policy details from the Monetary Authority of Singapore or Reserve Bank of India remain unreported in current datasets, the stability suggests coordinated management of inflation differentials and interest rate policies. Trade balance flows between the nations likely anchor the exchange band.
Current 0.41% monthly volatility ranks among the lowest for Asian emerging market pairs, making this corridor particularly suitable for recurring payments and salary transfers.
Traditional institutions routinely apply 2–5% spreads above live mid-market rates. On a 10,000 SGD transfer, this gap equates to 1,440–3,600 INR in excess costs compared to fintech alternatives.
How Has the SGD to INR Pair Performed Over Recent Periods?
- Last 24 Hours: Rates oscillated within a narrow band, closing near 72.39 INR according to market data.
- 7-Day Period: Range-bound between 72.11 and 73.48 INR, averaging 72.56 with minimal directional bias.
- 30-Day Window: Broader spectrum from 71.58 to 73.79 INR, settling at 72.65 average as volatility ticked up to 0.41%.
- 90-Day Context: Data indicates sustained trading around the 72 INR handle, with gradual rupee strength emerging against the Singapore dollar.
- 12-Month View: Charting platforms show consistent INR appreciation with low volatility throughout the annual cycle.
What Do We Know for Certain About Current SGD to INR Rates?
Established Facts
- Mid-market rate hovers near 72.30 INR per SGD
- Provider quotes span 71.62–73.41 INR range
- Volatility measures 0.24% (7-day) and 0.41% (30-day)
- Inverse rate holds steady at ~0.014 SGD per INR
- Fintech platforms consistently undercut bank spreads
Remaining Uncertainties
- Specific RBI intervention levels not publicly detailed
- MAS policy stance on SGD valuation undisclosed
- Long-term 2025–2026 forecast data unavailable
- Exact timing of future volatility spikes unpredictable
What Is the Significance of the Singapore Dollar to Indian Rupee Pair?
The SGD/INR corridor facilitates substantial remittance flows from Singapore’s migrant workforce to India, alongside bilateral trade in electronics, pharmaceuticals, and petrochemicals. Ceiling Fan With Light Singapore – Best DC Models For HDB Flats represents the type of consumer goods trade that relies on stable exchange rates for pricing consistency.
Corporate treasuries utilize this pair for hedging regional procurement costs, while individual senders benefit from the low-volatility environment that reduces timing risk for routine transfers.
Which Sources Provide Authoritative SGD to INR Data?
The current mid-market SGD to INR exchange rate is approximately 72.30 INR per 1 SGD, with minor variations across providers ranging from 71.62 to 73.41 INR per SGD.
Aggregated market data via Wise, Xe, and OFX
Summary: Navigating SGD to INR Exchange
The Singapore Dollar to Indian Rupee rate currently trades near 72.30 INR, with provider spreads varying by nearly 2 INR between fintech platforms and traditional banks. Low volatility under 0.5% monthly supports reliable transfer planning, though users should verify real-time quotes before executing transactions. For unrelated cultural content, see Yeon Jung-hoon – Age, Wife Han Ga-in, Dramas & 2024 Rumors.
Frequently Asked Questions
What affects SGD to INR volatility?
Trade balances between Singapore and India, regional interest rate differentials, and global risk sentiment drive minor fluctuations. Current volatility remains exceptionally low at 0.41% monthly.
Is the SGD to INR rate fixed?
No. The rate floats freely according to foreign exchange market forces, though both the MAS and RBI monitor movements to prevent disorderly conditions.
What is the historical low for SGD/INR?
Specific historical lows were not identified in current datasets. Twelve-month charts show gradual INR appreciation, suggesting recent rates near 71.58 represent stronger rupee levels.
How often do SGD to INR rates change?
Digital platforms refresh rates every 60 seconds during market hours. Interbank rates fluctuate continuously while retail rates may update less frequently.
Which provider offers the best rate for large transfers?
OFX and Revolut typically provide competitive rates for transfers exceeding 10,000 SGD, though exact quotes require real-time comparison against mid-market benchmarks.
More related posts
 IKEA Alexandra Opening Hours: Store, Restaurant & Bistro
 Chiam See Tong Illness: Stroke, Hip Injury Updates
 UOB Credit Card Malaysia: Best 2026 Reviews & Benefits
 Toa Payoh Central Food: Best Hawker Stalls & Eats Guide
 Best Restaurants Near Me in Dublin: Top Picks 2026
 Authentic Claypot Chicken Rice Recipe (Malaysian Style)
 Al-Nassr vs Kawasaki – 2-3 Semi-Final Upset
 Singapore MRT Map: PDF Download, Latest Guide & Future
